MODULE 10

Data and Statistics through Official and Unofficial Sources

MODULE DETAILS

What Is It?

The inclusion of SDG 16 in the global indicator framework of the 2030 Agenda constituted a milestone in and of itself.

However, official statistics on SDG 16-related issues continue to present challenges in terms of data coverage and quality, particularly compared to other sectors, e.g., poverty, health, and education.

Going forward, these challenges call on governments and partners/relevant stakeholders to:

  • Invest in official statistics and fortify the independence of National Statistical Offices (NSOs), and
  • Overcome resistance in the production and use of official statistics on ‘sensitive’ topics or those perceived as difficult to measure (corruption); and
  • Advance practical and innovative partnership with “non-official” data sources.

Data Gaps

The significant data gaps in the official SDG 16 indicators are primarily due to:

  • methodological issues,
  • limited resources, both financial and human, and
  • the capacity of national statistical offices (NSOs) to collect data.

Additional challenges also exist in relation to a number of conceptual gaps in the SDG 16 indicators themselves and the politically sensitive issues that SDG 16 indicators aim to measure, for example, external political efficacy.

Data Gaps, Solutions

To address these challenges, various solutions have been put forward, including:

  • Broaden global, regional, and national monitoring of SDG 16 to include non-official data sources alongside official data sources.
  • Expand the number and diversity of civil society data producers and other non-official data producers – especially those representing local and marginalized voices;
  • Add indicators that more accurately reflect target objectives; and
  • Increase acceptance by Member States, NSOs and UN custodian agencies of the role and place of civil society non-official methodologies and data in monitoring processes.

Similarly, the Praia Group’s Handbook on Governance Statistics highlights the benefits of strengthening collaboration between NSOs and other entities inside and outside government, while reiterating the centrality of NSOs as the coordinating node of national statistical systems. NSOs are also increasingly running online platforms that track SDG progress at national levels.

This includes better integration of often-underutilized administrative data systems across government institutions, for example:

  • Electoral Management Bodies,
  • Public Service Commissions,
  • Ministries of Public Administration,
  • Parliamentary and Ministerial Secretariats,
  • Judicial Service Commissions,
  • Ministries of Justice & Health, Education, and related institutions, and

Bottom Line: VNR analysis makes clear that the lack of reliable and disaggregated statistics is one of SDG 16’s top challenges for all countries. Set against a global pandemic backdrop, traditional data collection, such as in-person household surveys, will be increasingly untenable. However, increased use of or reliance on digital data gathering tools can risk excluding harder to reach communities.

This calls for greater collaboration and coordination amongst all SDG 16 data actors, both within and outside of government. 

Why Is It Important

At its best, statistics are used to track, monitor, and inform policy making and implementation in a transparent, participatory, and accountable manner.

Evidence shows that monitoring and reporting is critical to driving action. Evidence also demonstrates significant data gaps in measuring SDG 16 (progress and backsliding) and therefore in VNR and post-VNR processes for strengthened implementation.

Greater investment in data sources is therefore critical to realizing more peaceful, just, and inclusive societies, particularly in contexts and countries where there are risks of falling into conflict or otherwise backsliding on SDG 16.

NSOs and Non-Official Data Sources

Greater investment in NSOs and better collaboration across data producers, such as civil society, is critical to measuring progress and driving implementation (while being careful not to create issues related to private or ethics, more broadly).

NSOs may face challenges across several fronts, from resource constraints for production of quality data in line with the principles for official statistics, to dissemination of statistics and the coordination of SDG 16-related data within the national statistical system. Notwithstanding their own challenges, non-official data sources can help to fill methodological and conceptual gaps by:

  • Supplementing decreasing budgets by incorporating new statistical applications, tools and technologies,
  • Offering informed advisory support in a diverse group of domains, and by
  • Reaching hard-to-access population groups through a methodologically sensitive approach.

In doing so, they can reduce capacity strain on NSOs while encouraging their (NSOs) autonomy.
To this end, civil society is key to supporting and complementing government efforts to collect, monitor and report on data for SDG 16, in part due to their engagement with relevant national and local actors.

Similarly, NHRIs, may be well-positioned in data collection and data disaggregation in terms of non-discriminatory law and policies, as well as human rights violations, given their relative proximity to and interaction with relevant communities and individuals.

Such data can then support the design and implementation of people-centred, national and local development policies, strategies and plans, as linked to VNRs or VLRs (for more on VLRs, see module 4).

Bottom Line: Greater coherence, communication and collaboration are required among NSOs, UN custodian agencies, NHRIs, civil society and others. In a world increasingly dominated by data (rigorous and weak) and struggling with a global pandemic, this type of collaboration is even more important.

How Is It Approached?

Data Collection Methodologies: From Surveys to Big Data

In collecting data, NSOs and others often draw data from surveys (including household surveys, business surveys and population surveys) as well as censuses, administrative records. In addition, expert assessments and ‘big data’, often using multiple sources to assess progress on an indicator, are increasingly used.

In more remote or conflict-affected areas, new technologies, such as satellite data and imagery, may be well-equipped to address a lack of data.

The examples and case studies below, from indicator identification and methodological standards to bridging gaps in data sources and civil society spotlight reports, highlight various approaches taken to strengthen data for SDG 16.

Improving Data through National Statistical Development Strategies

Many countries have plans to improve data collection through National Statistical Development Strategies. Across sectors and stakeholders, innovative, multi-stakeholder approaches are being advanced to bring different data sources together, as led by governments, civil society, the UN, international organizations, and others.

Initiatives such as the Leave No One Behind Project focus on community-driven data to fill knowledge gaps at the local level in SDG monitoring and better understand drivers of vulnerability and marginalization.

Indicator Identification, Methodological Standards and Supplementary Data

In the absence of a single set of agreed definitions and categories for the information required for the SDG 16.1.2 indicator on conflict-related deaths, the OHCHR, the custodian agency for this indicator (in addition to 16.10.1, 16.A.1 and 10.3.1/16.b.1) held consultations and coordination events with institutions working on conflict-related issues.

The goal was to harmonize and build upon existing standards and methodologies and to integrate available data into a single collection that serves the purposes of this indicator.

  • This process has involved a range of stakeholders, including NSOs, as part of the work of the Praia City Group on Governance Statistics and the Global Alliance of NHRIs.

In The Netherlands, the Dutch National Statistics Office (CBS), starting with only 30 percent coverage of SDG indicators in 2016, embarked on a consultation process with 30 different data-producing organizations, many from civil society and with a record of independent and responsible data protection.

  • This consultation led to supplementary data that met a set of criteria and guaranteed compliance with data standards produced by CBS. The result was a rise to 51 percent in SDG indicator coverage.

For a comprehensive guide on SDG16+ indicators, check out the TAP Network SDG16+ Civil Society Toolkit’s “SDG16+ Indicators Guide”, which features a compendium of national-level indicators and data sources to track progress on SDG16+.

Case Study: SDG Corruption Monitoring Dashboards and Mainstreaming SDG 16, the Rwandan Experience

Civil Society Reporting and NSOs bridging divides within and outside of Government

As highlighted earlier, civil society Spotlight Reports or parallel reporting offer an important means of addressing what many see as weaknesses in the official monitoring framework – the multi-dimensional nature of targets, data availability and the perceived credibility (or lack of credibility) of data generated by government agencies.

There are many resources for CSOs to draft and develop Spotlight Reports to monitor implementation efforts within their contexts. In 2021, the TAP Network updated its Spotlight Reporting Guidelines as a part of the updated marquee resource, the SDG16+ Civil Society Toolkit.  The updated guidelines, “Approaches and Methodologies for Civil Society Reporting on the SDGs and 2030 Agenda,” provide an outline template for a civil society report and guiding questions to consider answering during the crafting process.

Case Study: Transparency International SDG 16 Spotlight Reporting: Tracking Global Progress Towards Anti-Corruption Targets

Separately, certain Offices of National Statistics have actively sought to improve outreach both within and outside of government, often through the use of portal, in order to get the data needed to effectively report.

Case Study: User-Friendly Portals and Inter-governmental Data Focal Points: Office for National Statistics (ONS), UK

Private Sector Collaboration

Finally, collaboration with the private sector is also an area of increasing interest in terms of data collection and monitoring.

While this has less been the case for SDG 16 as opposed to other SDGs, the private sector can also be a useful data source in strengthening VNR and post-VNR processes (see private sector module). 

Case Study: SDG Corruption Monitoring Dashboards and Mainstreaming SDG 16, the Rwandan Experience

Starting in 2018, Transparency International (TI) Rwanda began to support national efforts to produce the country’s 2019 VNR. From the beginning, TI Rwanda was keen to emphasize the linkages between corruption and the SDGs and so produced a scoping study on the effect of corruption on national efforts to meet SDGs 1, 3, 4, 5, 8 and 13.

While corruption is relatively high on the national agenda, key SDG implementers in line ministries are not sufficiently sensitized to the risks that corruption poses to the country’s targets under the 2030 Agenda. To address this issue, TI developed a comprehensive approach intended to: (1) produce evidence that corruption hinders progress towards national development goals; (2) identify innovative mechanisms to mitigate corruption risks in SDG implementation; and (3) track the effectiveness of these measures over time jointly with SDG implementers.

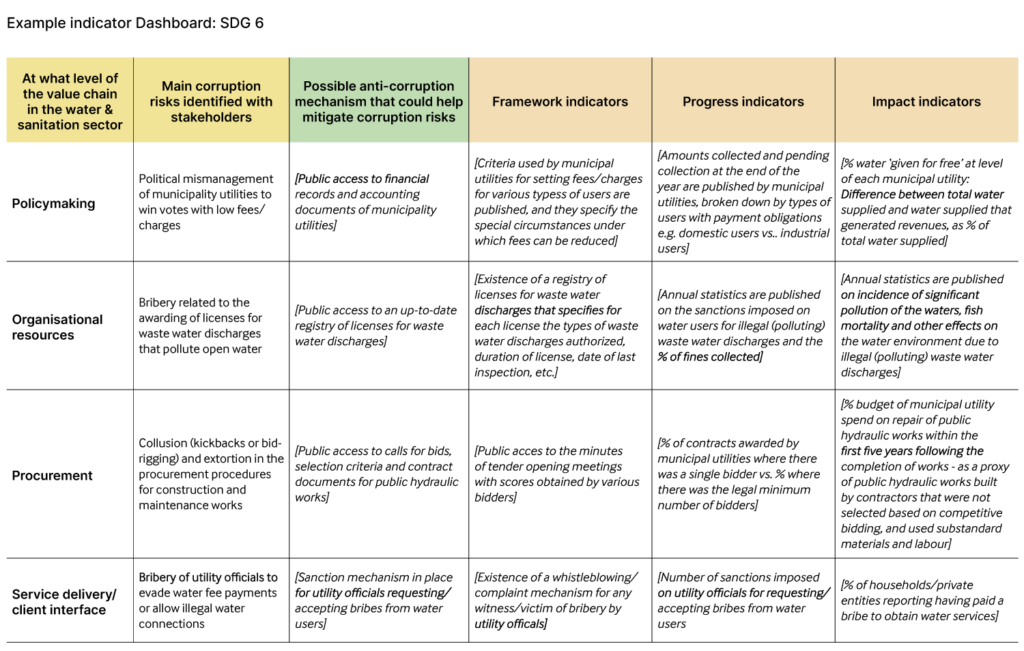
The approach involves producing a one-page ‘dashboard’ that combines official and non-official data sources for each SDG relevant to TI Rwanda’s work. By consolidating various scattered datasets into one coherent framework, the dashboard provides a highly actionable roadmap to reduce corruption vulnerabilities in SDG implementation. The approach involves a three-step process intended to bring together the various data and expertise used by individual programmes into a single dashboard tailored to individual SDGs.

First, an initial corruption risk assessment is conducted in collaboration with sectoral experts to identify and prioritize the main risks at each stage of the SDG sectoral value chain, from the policymaking level to the point of service delivery. Once risks have been mapped for each SDG of interest, the second step is to launch consultations with government, businesspeople and affected communities to match each prioritized corruption risk to corresponding anti-corruption safeguards designed to mitigate that risk. The final stage involves producing a monitoring framework that pairs each anti-corruption safeguard identified to a combination of different indicators that consciously draw on a range of data sources to provide a holistic appraisal of the effectiveness of anti-corruption mechanisms in place.

Synthesizing this information into the dashboard’s monitoring framework allows SDG implementers to track whether their programmes are becoming more or less vulnerable to corruption, based on an overarching conceptual model that is sensitive to local context. While the tool is in the early stages of implementation, it is already clear that it lends itself to evidence-based advocacy, as it provides an at-a-glance understanding of the corruption risks that can undermine progress towards individual SDGs.

That each dashboard’s framework draws on different data providers, including government sources and third-party assessments as well as data produced by the organization itself, is a strength of the tool, as it allows for the verification, comparison and triangulation of the official narrative as told in the VNR. As such, it is clear that the country’s VNR is simply a first step in the process and that the official indicator set agreed upon by the IAEG must be complemented with more locally meaningful data to ensure transparency, accountability, and participation in the 2030 Agenda.

Take-aways and Going Forward: TI Rwanda believes that the tool could be further developed into a multi-partner project by which different organizations input different data, building on the monitoring processes of each. Ultimately, the tool could be transferred to impartial government agencies, such as NSOs, to institutionalize the monitoring of governance issues in SDG implementation. Another possibility involves modifying the dashboard to turn it into a tool for community action to help citizens hold local leaders accountable in reporting corruption incidences.

A key lesson has been the pivotal importance of outreach; early communication is needed to ensure that relevant stakeholders feel addressed and know that the tool is holding them to account for their performance on specific SDGs. So far, TI Rwanda has combined desk research with online expert surveys, followed up by workshops to assess the severity of risks identified. Hosting small multi-stakeholder workshops with experts from government, the private sector and civil society during the process of developing each SDG dashboard was beneficial. The reason for this is that involving partners at an early stage helped to nurture ownership and buy-in from government and non-government representatives, which also facilitates subsequent access to the data needed to monitor progress.

* An Example of a Country Score Card is included in the Appendix.

* This case study was provided by Transparency International Rwanda in 2019.
Case Study: Transparency International SDG 16 Spotlight Reporting: Tracking Global Progress Towards Anti-Corruption Targets

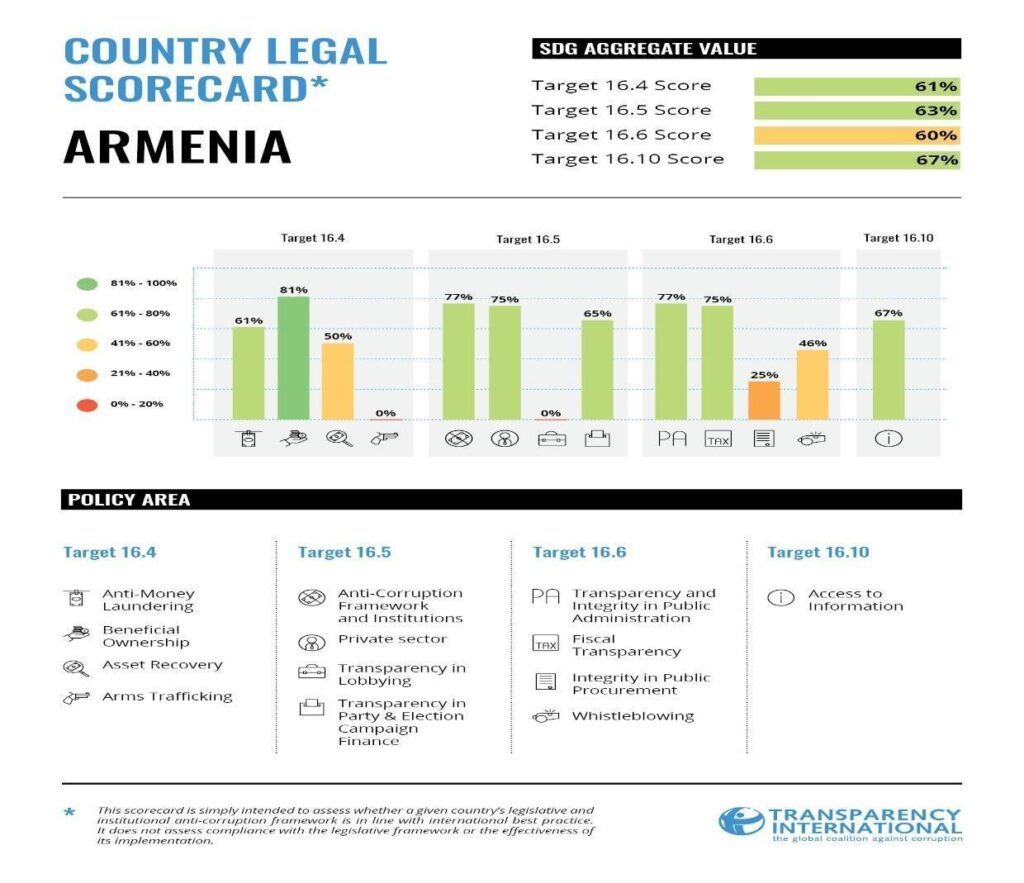
In 2017, Transparency International (TI) developed a common methodology to enable civil society organizations to track their countries’ progress towards four SDG 16 targets especially relevant for anti-corruption: 16.4 on illicit financial flows, 16.5 on corruption and bribery, 16.6 on accountable and transparent institutions and 16.10 on access to information and fundamental freedoms. Since then, over 45 of TI’s national chapters have used the tool to produce spotlight reports that provide independent appraisals of their governments’ anti-corruption efforts, which are essential to improve implementation of the 2030 Agenda across all SDGs.

Recognizing the lack of available data for the IAEG-SDG indicators, TI’s methodology intentionally deviates from the official indicator set, drawing on a wider range of alternative data sources to scrutinize the often-uncritical assessments of national progress presented in VNRs. Going beyond the narrow understanding of corruption captured by the official global indicators, TI’s spotlight reports provide a more holistic assessment of the underlying conditions and drivers of corruption at national level.

The overall aim has been to produce evidence to supplement the official government reports submitted as part of the VNR process. Looking at the quality of national legislative and institutional anti-corruption frameworks and their actual implementation, the tool is designed to enable chapters and other national stakeholders to develop actionable recommendations across a range of relevant policy areas, from anti-money laundering to whistleblowing. In this way, the approach seeks to embed cyclical VNR reporting into a longer process of iterative reform, generating data that can feed into governmental SDG reporting processes in each country.

An independent impact assessment of the tool conducted in 2019 revealed that, among other outcomes, TI’s spotlight reports influenced anti-corruption action taken by governments in Greece and Sri Lanka; informed anti-corruption action taken by international organizations in Togo; enabled TI to establish new partnerships with government agencies in Uganda; and led to a better understanding of national anti-corruption frameworks in Hungary. At national level, there has also been some on-the-ground coordination between TI chapters and other CSOs around VNRs and spotlight reporting.

For these spotlight reports to realize their true potential, however, VNR processes need to give due regard to civil society’s attempt to incorporate a wider range of indicators and data sources than those agreed upon by the IAEG-SDGs. Civil society’s efforts to provide a baseline assessment that can be used as a benchmark to monitor progress towards the 2030 targets should be welcomed by all governments genuinely committed to enhancing peace, justice and strong institutions.

Take-Aways and Going Forward: In many countries, the tool provided a valuable opportunity for civil society organizations to demonstrate their value as providers of actionable data that can help remedy vulnerabilities in a country’s anti-corruption framework. Framing the assessment as a contribution to national-level SDG implementation enabled them to engage the government through internationally recognized channels, particularly if findings were used to complement VNR reports.

While the bulk of the indicators can be answered through desk research, interviews proved useful in verifying findings and gleaning additional insights from public officials, elected representatives, civil society and private sector firms. Moreover, establishing a working rapport with interviewees in government provided TI chapters with ‘entry points’ to key institutions when it came to the dissemination of findings and advocating for the adoption of policy recommendations. However, given that the primary purpose of Spotlight Reports is to scrutinize government performance, there remains a need for distance and researchers have to be somewhat sceptical of their interlocutors’ assertions. Freedom-of-information requests have proven important in filling gaps where insufficient data is publicly available, not least as they can provide information about implementation and enforcement of anti-corruption measures, with unsatisfactory responses often constituting a finding in their own right.

* An example of a Country Score Card is included in the Appendix.

* This case study was provided by Transparency International in 2019.

Case Study: User-Friendly Portals and Inter-governmental Data Focal Points: Office for National Statistics (ONS), UK

The role of ONS is to provide UK data for the global SDG indicators; it is in this way that ONS supports the UK Government and non-government actions in their work implementing the SDGs. In line with the ethos of transparency and ‘accountable and inclusive institutions’, ONS UK publishes all of its SDG data on an open-source, reusable, customizable and user-friendly website developed specifically for this purpose. This sets a baseline for future reports, allowing us to see what progress has been made.

In supporting and streamlining the data collection process during the VNR process, ONS UK provided templates to other government departments to complete when compiling tables and charts to make quality assurance easier. ONS UK based these in part on the methodology requirements in the UN Statistics handbook on SDG indicators. Further, ‘check-in’ meetings (similar to ‘office hours’) were set for designated times and online chat functions were available for data focal points across government to ask questions. Overall, ONS UK worked with a number of stakeholders to promote the VNR and to recruit case studies and engage in the VNR process and produced a strongly data-led VNR.

Following publication, ONS UK worked with the lead policy team on VNR follow-up and review. This involved internal ‘wash-up’ meetings with statistical contacts and external ones with stakeholder groups. ONS UK continues to use the network of contacts built during the process to identify new data sources.

Take-Aways and Going Forward: Processes give all those involved in the preparation of the VNR the support they need. Quality review is also key, and, for follow-up, it is important to maintain a clear audit trail and to maintain the relationships/networks established for future action. The VNR provides a baseline so that future reports can focus on progress made since the first.

Guidelines on how to prepare a second VNR as a follow-up, rather than as a second, stand-alone report, would make it easier to measure progress more meaningfully over time. Further, more and better disaggregated data would enable policymakers and non-governmental decision makers to make better-informed decisions for a sustainable future.

* This case study draws from 2019 interviews with ONS, UK.

MODULE DETAILS

Next Module

Module 11: Data and Statistics through Official and Unofficial Sources

Embed this Module

Share the Module

Case Study: SDG Corruption Monitoring Dashboards and Mainstreaming SDG 16, the Rwandan Experience

Starting in 2018, Transparency International (TI) Rwanda began to support national efforts to produce the country’s 2019 VNR. From the beginning, TI Rwanda was keen to emphasize the linkages between corruption and the SDGs and so produced a scoping study on the effect of corruption on national efforts to meet SDGs 1, 3, 4, 5, 8 and 13.

While corruption is relatively high on the national agenda, key SDG implementers in line ministries are not sufficiently sensitized to the risks that corruption poses to the country’s targets under the 2030 Agenda. To address this issue, TI developed a comprehensive approach intended to: (1) produce evidence that corruption hinders progress towards national development goals; (2) identify innovative mechanisms to mitigate corruption risks in SDG implementation; and (3) track the effectiveness of these measures over time jointly with SDG implementers.

The approach involves producing a one-page ‘dashboard’ that combines official and non-official data sources for each SDG relevant to TI Rwanda’s work. By consolidating various scattered datasets into one coherent framework, the dashboard provides a highly actionable roadmap to reduce corruption vulnerabilities in SDG implementation. The approach involves a three-step process intended to bring together the various data and expertise used by individual programmes into a single dashboard tailored to individual SDGs.

First, an initial corruption risk assessment is conducted in collaboration with sectoral experts to identify and prioritize the main risks at each stage of the SDG sectoral value chain, from the policymaking level to the point of service delivery. Once risks have been mapped for each SDG of interest, the second step is to launch consultations with government, businesspeople and affected communities to match each prioritized corruption risk to corresponding anti-corruption safeguards designed to mitigate that risk. The final stage involves producing a monitoring framework that pairs each anti-corruption safeguard identified to a combination of different indicators that consciously draw on a range of data sources to provide a holistic appraisal of the effectiveness of anti-corruption mechanisms in place.

Synthesizing this information into the dashboard’s monitoring framework allows SDG implementers to track whether their programmes are becoming more or less vulnerable to corruption, based on an overarching conceptual model that is sensitive to local context. While the tool is in the early stages of implementation, it is already clear that it lends itself to evidence-based advocacy, as it provides an at-a-glance understanding of the corruption risks that can undermine progress towards individual SDGs.

That each dashboard’s framework draws on different data providers, including government sources and third-party assessments as well as data produced by the organization itself, is a strength of the tool, as it allows for the verification, comparison and triangulation of the official narrative as told in the VNR. As such, it is clear that the country’s VNR is simply a first step in the process and that the official indicator set agreed upon by the IAEG must be complemented with more locally meaningful data to ensure transparency, accountability, and participation in the 2030 Agenda.

Take-aways and Going Forward: TI Rwanda believes that the tool could be further developed into a multi-partner project by which different organizations input different data, building on the monitoring processes of each. Ultimately, the tool could be transferred to impartial government agencies, such as NSOs, to institutionalize the monitoring of governance issues in SDG implementation. Another possibility involves modifying the dashboard to turn it into a tool for community action to help citizens hold local leaders accountable in reporting corruption incidences.

A key lesson has been the pivotal importance of outreach; early communication is needed to ensure that relevant stakeholders feel addressed and know that the tool is holding them to account for their performance on specific SDGs. So far, TI Rwanda has combined desk research with online expert surveys, followed up by workshops to assess the severity of risks identified. Hosting small multi-stakeholder workshops with experts from government, the private sector and civil society during the process of developing each SDG dashboard was beneficial. The reason for this is that involving partners at an early stage helped to nurture ownership and buy-in from government and non-government representatives, which also facilitates subsequent access to the data needed to monitor progress.

* An Example of a Country Score Card is included in the Appendix.

* This case study was provided by Transparency International Rwanda in 2019.
Case Study: Transparency International SDG 16 Spotlight Reporting: Tracking Global Progress Towards Anti-Corruption Targets

In 2017, Transparency International (TI) developed a common methodology to enable civil society organizations to track their countries’ progress towards four SDG 16 targets especially relevant for anti-corruption: 16.4 on illicit financial flows, 16.5 on corruption and bribery, 16.6 on accountable and transparent institutions and 16.10 on access to information and fundamental freedoms. Since then, over 45 of TI’s national chapters have used the tool to produce spotlight reports that provide independent appraisals of their governments’ anti-corruption efforts, which are essential to improve implementation of the 2030 Agenda across all SDGs.

Recognizing the lack of available data for the IAEG-SDG indicators, TI’s methodology intentionally deviates from the official indicator set, drawing on a wider range of alternative data sources to scrutinize the often-uncritical assessments of national progress presented in VNRs. Going beyond the narrow understanding of corruption captured by the official global indicators, TI’s spotlight reports provide a more holistic assessment of the underlying conditions and drivers of corruption at national level.

The overall aim has been to produce evidence to supplement the official government reports submitted as part of the VNR process. Looking at the quality of national legislative and institutional anti-corruption frameworks and their actual implementation, the tool is designed to enable chapters and other national stakeholders to develop actionable recommendations across a range of relevant policy areas, from anti-money laundering to whistleblowing. In this way, the approach seeks to embed cyclical VNR reporting into a longer process of iterative reform, generating data that can feed into governmental SDG reporting processes in each country.

An independent impact assessment of the tool conducted in 2019 revealed that, among other outcomes, TI’s spotlight reports influenced anti-corruption action taken by governments in Greece and Sri Lanka; informed anti-corruption action taken by international organizations in Togo; enabled TI to establish new partnerships with government agencies in Uganda; and led to a better understanding of national anti-corruption frameworks in Hungary. At national level, there has also been some on-the-ground coordination between TI chapters and other CSOs around VNRs and spotlight reporting.

For these spotlight reports to realize their true potential, however, VNR processes need to give due regard to civil society’s attempt to incorporate a wider range of indicators and data sources than those agreed upon by the IAEG-SDGs. Civil society’s efforts to provide a baseline assessment that can be used as a benchmark to monitor progress towards the 2030 targets should be welcomed by all governments genuinely committed to enhancing peace, justice and strong institutions.

Take-Aways and Going Forward: In many countries, the tool provided a valuable opportunity for civil society organizations to demonstrate their value as providers of actionable data that can help remedy vulnerabilities in a country’s anti-corruption framework. Framing the assessment as a contribution to national-level SDG implementation enabled them to engage the government through internationally recognized channels, particularly if findings were used to complement VNR reports.

While the bulk of the indicators can be answered through desk research, interviews proved useful in verifying findings and gleaning additional insights from public officials, elected representatives, civil society and private sector firms. Moreover, establishing a working rapport with interviewees in government provided TI chapters with ‘entry points’ to key institutions when it came to the dissemination of findings and advocating for the adoption of policy recommendations. However, given that the primary purpose of Spotlight Reports is to scrutinize government performance, there remains a need for distance and researchers have to be somewhat sceptical of their interlocutors’ assertions. Freedom-of-information requests have proven important in filling gaps where insufficient data is publicly available, not least as they can provide information about implementation and enforcement of anti-corruption measures, with unsatisfactory responses often constituting a finding in their own right.

* An example of a Country Score Card is included in the Appendix.

* This case study was provided by Transparency International in 2019.

Case Study: User-Friendly Portals and Inter-governmental Data Focal Points: Office for National Statistics (ONS), UK

The role of ONS is to provide UK data for the global SDG indicators; it is in this way that ONS supports the UK Government and non-government actions in their work implementing the SDGs. In line with the ethos of transparency and ‘accountable and inclusive institutions’, ONS UK publishes all of its SDG data on an open-source, reusable, customizable and user-friendly website developed specifically for this purpose. This sets a baseline for future reports, allowing us to see what progress has been made.

In supporting and streamlining the data collection process during the VNR process, ONS UK provided templates to other government departments to complete when compiling tables and charts to make quality assurance easier. ONS UK based these in part on the methodology requirements in the UN Statistics handbook on SDG indicators. Further, ‘check-in’ meetings (similar to ‘office hours’) were set for designated times and online chat functions were available for data focal points across government to ask questions. Overall, ONS UK worked with a number of stakeholders to promote the VNR and to recruit case studies and engage in the VNR process and produced a strongly data-led VNR.

Following publication, ONS UK worked with the lead policy team on VNR follow-up and review. This involved internal ‘wash-up’ meetings with statistical contacts and external ones with stakeholder groups. ONS UK continues to use the network of contacts built during the process to identify new data sources.

Take-Aways and Going Forward: Processes give all those involved in the preparation of the VNR the support they need. Quality review is also key, and, for follow-up, it is important to maintain a clear audit trail and to maintain the relationships/networks established for future action. The VNR provides a baseline so that future reports can focus on progress made since the first.

Guidelines on how to prepare a second VNR as a follow-up, rather than as a second, stand-alone report, would make it easier to measure progress more meaningfully over time. Further, more and better disaggregated data would enable policymakers and non-governmental decision makers to make better-informed decisions for a sustainable future.

* This case study draws from 2019 interviews with ONS, UK.